GIS Project Management · 2026
Diagnosing Intermittent Web-Map Rendering Failures
An observability and root-cause analysis workflow for a production GeoNode / GeoServer SDI platform — built with synthetic monitoring, Grafana, Loki and AI-assisted log analysis.
Project Summary
The production web-map on ZanSDI, Zanzibar's national Spatial Data Infrastructure platform, occasionally failed to render — silently, intermittently, and without correlating to load, server health or any obvious infrastructure signal. This case study documents how we investigated and resolved it: by building a purpose-made observability stack around synthetic user monitoring and centralized log analysis, rather than relying on standard uptime checks that had no way of detecting the failure.
The investigation traced the problem to stale, silently-dead database connections being reused by GeoFence, GeoServer's authorization component — and closed it out with configuration changes validated against the same monitoring pipeline that found it.
The Production Problem
ZanSDI is built on GeoNode and GeoServer. Its production web-map began exhibiting intermittent rendering failures with a frustrating profile: real, user-facing, and almost impossible to pin down.
- Map layers occasionally failed to render.
- Some map requests stayed pending for a long time before resolving or timing out.
- The issue occurred randomly and could not be reproduced on demand.
- It did not correlate with the number of active users.
- CPU, memory and general server health metrics looked normal throughout.
- The platform itself remained online and reachable at all times.
- Traditional infrastructure monitoring showed no obvious failures.
Key insight: the application stayed available while individual rendering requests silently failed. Uptime monitoring answers "is the service up?" — it has no way of answering "did this specific map request actually render?" That gap is what made the problem invisible to standard monitoring and is what the investigation had to solve for first.
Monitoring Architecture
We designed an ad-hoc observability solution combining infrastructure monitoring with synthetic user monitoring, so that every rendering failure would leave behind precise, correlated evidence: what failed, exactly when, and what the system was doing at that moment.
Synthetic monitoring & analytics pipeline
/ GeoFence → Raw observations
PostgreSQL → dbt
transformations → Grafana
dashboards
Log aggregation pipeline
system logs → Loki → Grafana
log dashboard
Investigation → resolution
identification → GeoFence config
improvements
On the infrastructure side, system and application logs were centralized with Loki and wired into Grafana alongside the existing monitoring stack. The objective was narrow and specific: preserve evidence from exactly the moments in which rendering problems occurred, so that a failure captured at 03:14 could be traced back to the log lines emitted at 03:14 — not inferred after the fact from aggregate metrics.
Synthetic Monitoring Workflow
The core of the investigation was an automated synthetic user that behaved like a real person using the map — repeatedly, continuously, and with every observation logged. Each monitoring cycle:
- Opened the production web map.
- Executed both anonymous and authenticated scenarios.
- Zoomed through a predefined set of map scales.
- Panned around the map to trigger new tile and feature requests.
- Issued real WMS and tile requests against the live GeoServer instance.
- Measured response times for every request.
- Recorded each request as successful, failed or pending.
- Captured a screenshot whenever a rendering problem occurred.
- Stored every observation in PostgreSQL for downstream analysis.
A dbt analytics layer transformed the raw observation rows into analytical models — cycle-level rollups, success-rate windows, response-time distributions — that fed Grafana directly. The resulting dashboards visualized:
- Monitoring cycle status (successful vs. failed) over time.
- Success rate over time.
- Failed requests.
- Pending requests.
- Average response time.
- Historical monitoring cycles, for pattern-spotting across days.
The whole pipeline ran automatically and continuously via GitHub Actions, so monitoring didn't depend on anyone manually kicking off a check — it was always running, always writing evidence, whether or not anyone was watching Grafana at the time.
Investigation Process
The monitoring ran continuously for several days. The diagnosis came from correlating three complementary sources of evidence, not from any single error message:
- 1
Synthetic monitoring results
The synthetic monitoring pipeline precisely identified the timestamps at which rendering failures occurred — down to the specific cycle, request and scenario.
- 2
Centralized log correlation
Those timestamps were cross-referenced against the Grafana log dashboards fed by Loki, surfacing GeoServer, GeoFence and infrastructure log activity around each failure window.
- 3
AI-assisted log analysis
AI-assisted analysis was used to inspect large volumes of correlated logs and identify recurring patterns across multiple, independent failure windows — patterns that were easy to miss when reading logs manually one incident at a time.
- 4
Convergent diagnosis
Rather than relying on a single log line or stack trace, the root cause emerged from the intersection of all three sources — the same underlying pattern showing up independently in the monitoring data, the logs and the AI-assisted review.
Monitoring in Practice
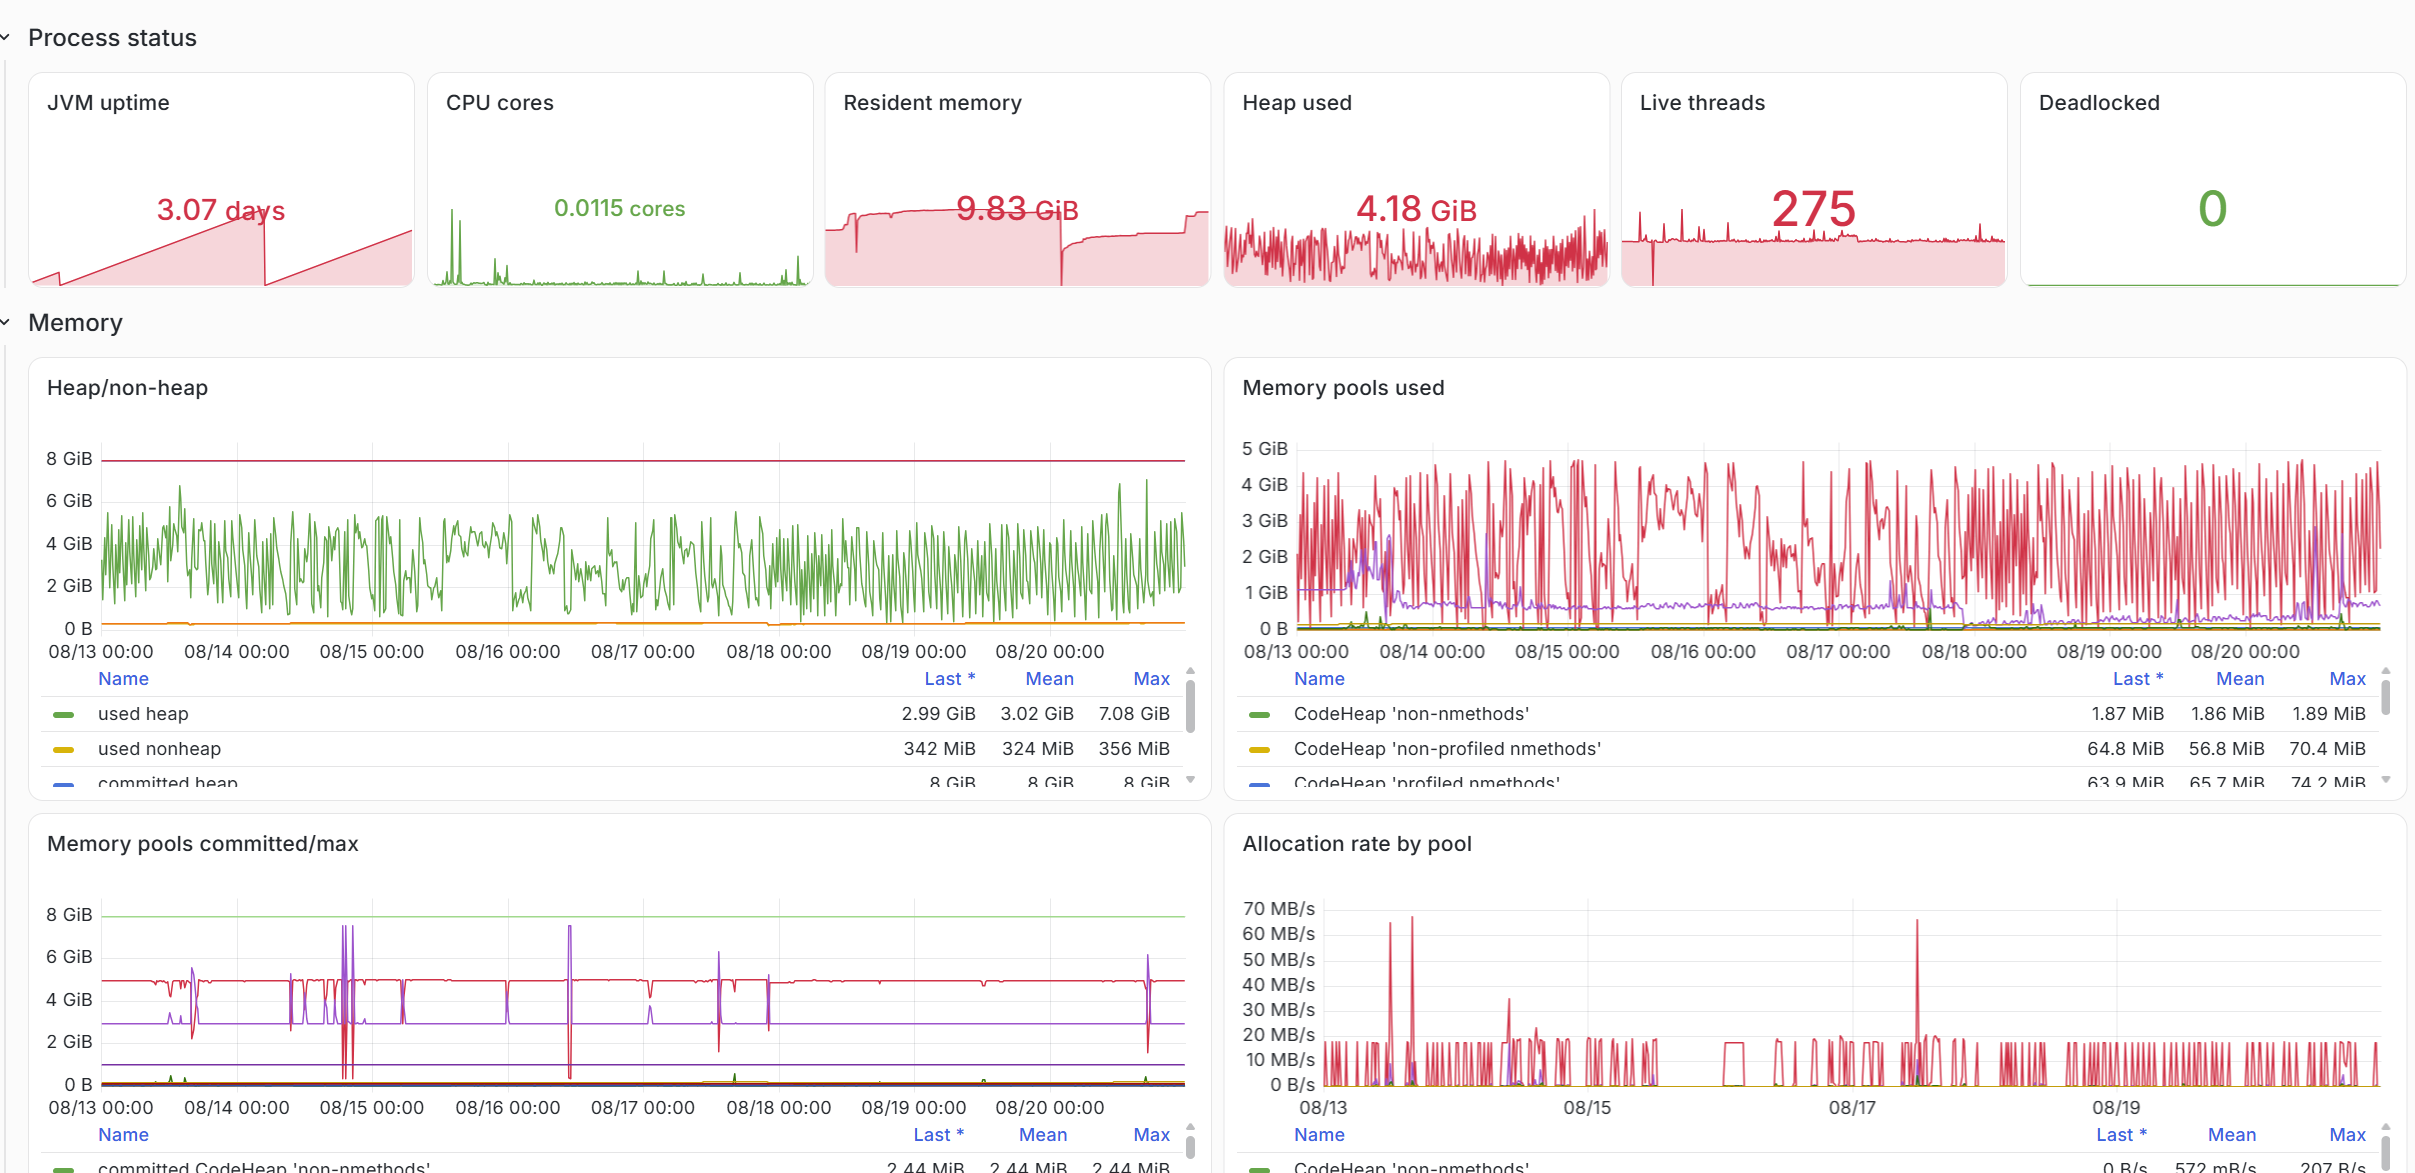
Centralized Grafana and Loki log analysis used to correlate GeoServer, GeoFence and infrastructure events during rendering failures.
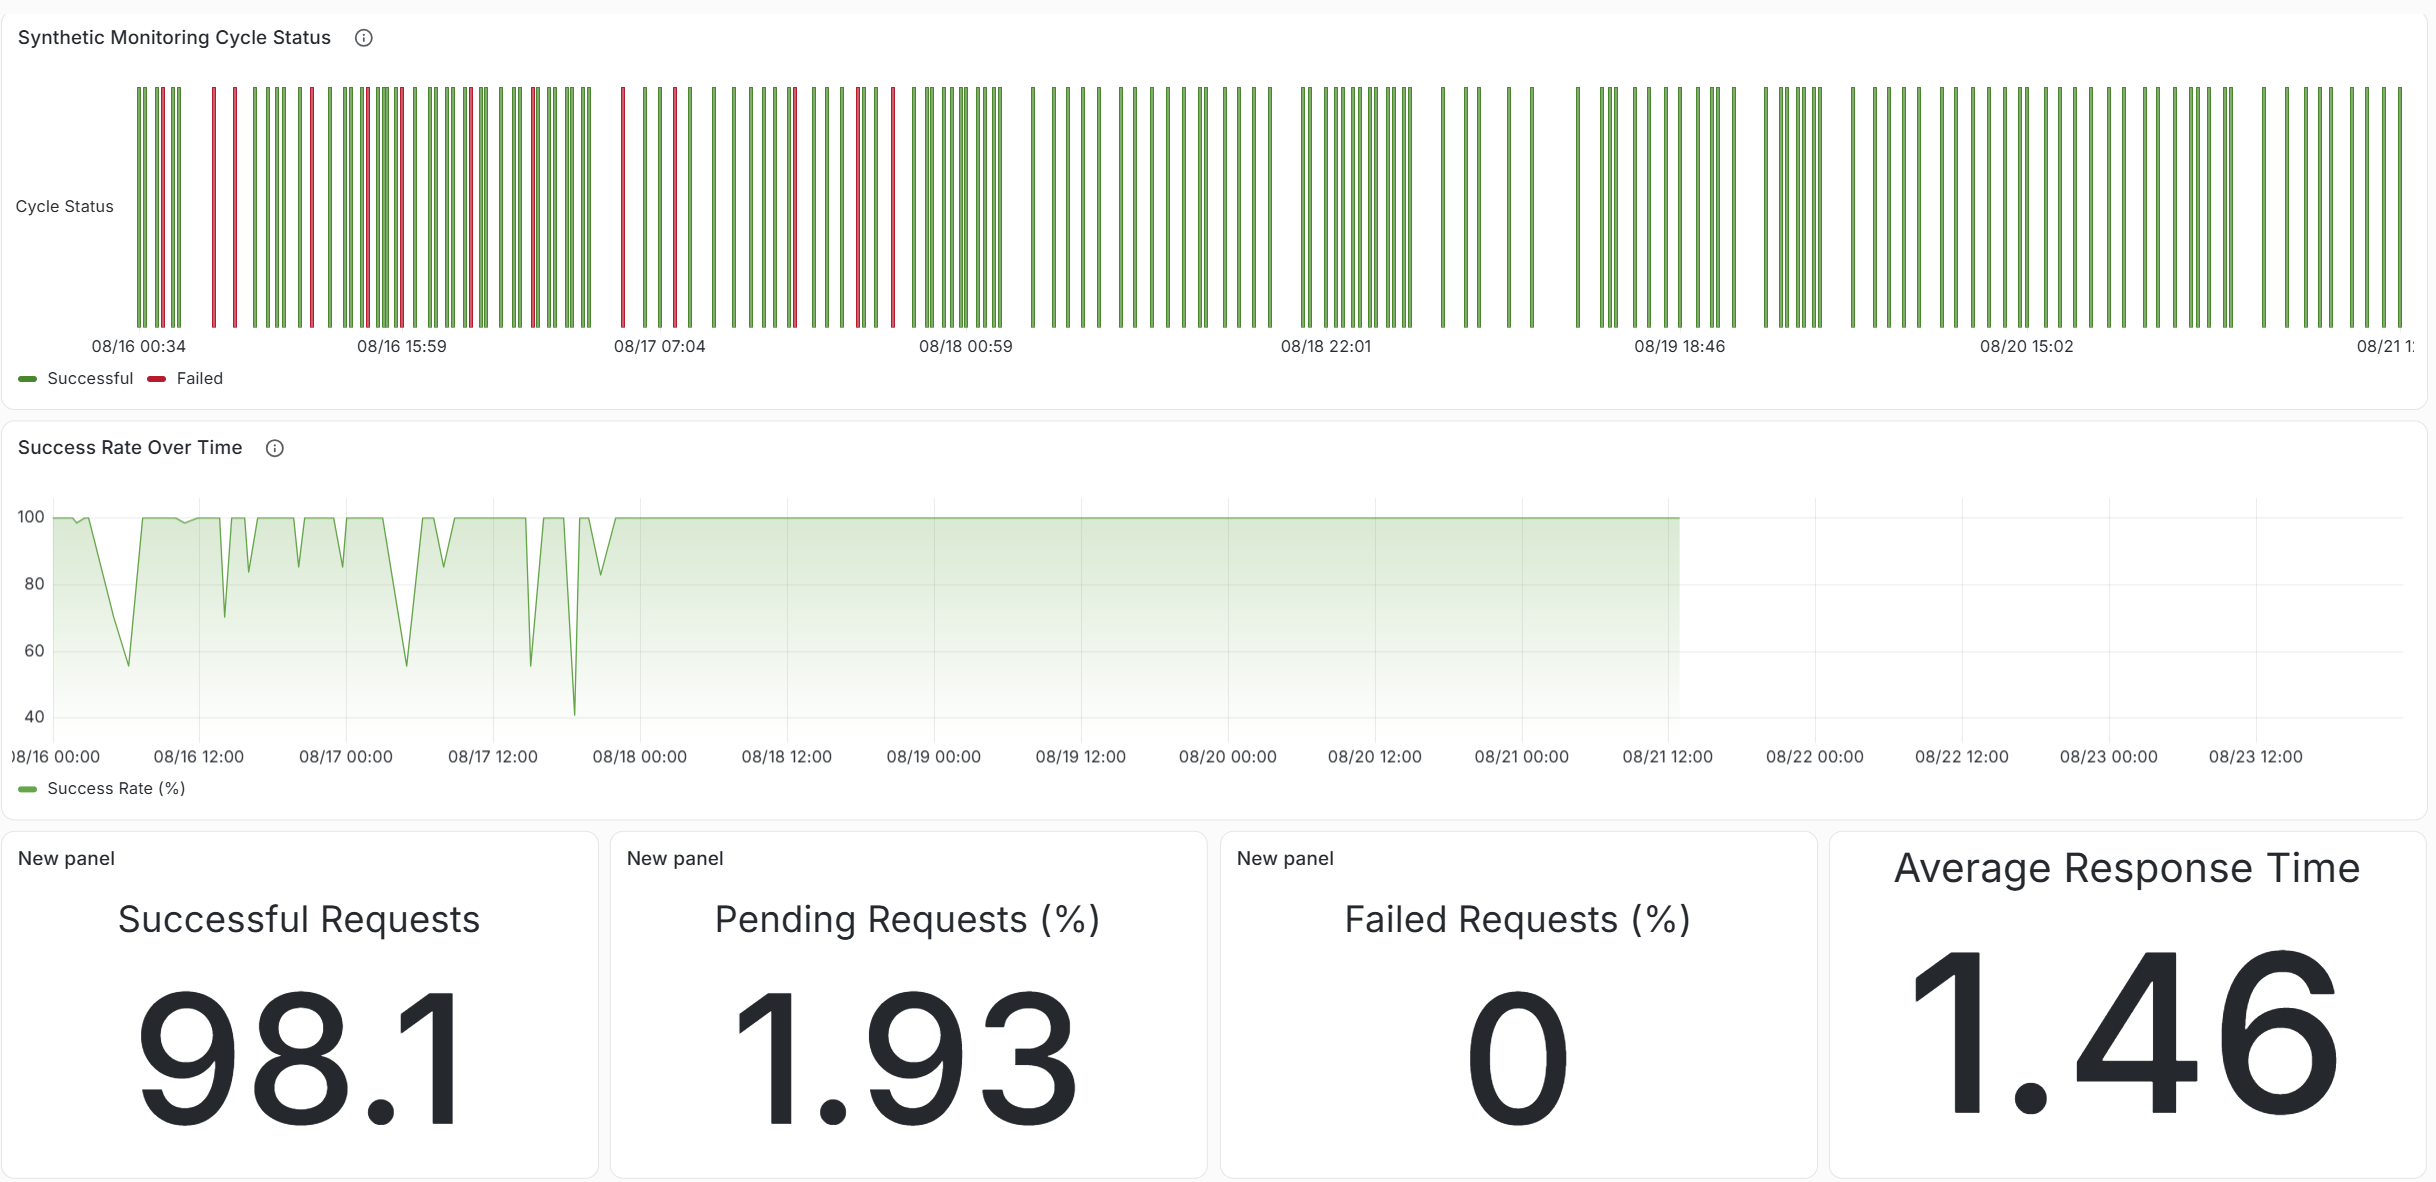
Synthetic monitoring dashboard showing monitoring cycles over time. Green bars indicate successful rendering sessions while red bars indicate monitoring cycles in which one or more expected rendering requests failed.
Root Cause
The investigation traced the intermittent rendering failures to GeoFence, the authorization component sitting in front of GeoServer. GeoFence reused stale database connections from its connection pool over the network. Some of those connections still appeared alive at the pool level but were no longer actually usable.
When a stale connection was handed out and reused, the request holding it would wait — sometimes for several minutes — before the connection finally timed out. Because this only happened when a specific unusable connection was drawn from the pool, it explained every symptom observed:
- Why rendering occasionally stalled rather than failing outright.
- Why users experienced missing map layers instead of a clear error.
- Why infrastructure monitoring still looked healthy — CPU, memory and uptime were never affected, only individual requests stuck behind a dead connection.
Resolution
The fix targeted GeoFence's database connection handling directly, so that requests could no longer block indefinitely on a connection that looked alive but wasn't:
- Test database connections before using them, rather than trusting pool state alone.
- Periodically remove stale idle connections from the pool.
- Enable TCP network keepalive so dead connections are detected sooner.
- Stop database connection attempts after 5 seconds.
- Stop waiting for database responses after 30 seconds.
- Stop waiting for an available pooled connection after 10 seconds.
Together, these changes prevented requests from blocking on a database connection that could never actually complete — replacing an unbounded, silent stall with a bounded, fast failure that the connection pool could recover from.
Outcome
- Synthetic monitoring continued running unchanged after the fix, using the same pipeline that had originally detected the problem.
- The previously observed intermittent rendering failures did not reoccur during the validation period.
- Grafana dashboards confirmed stable rendering behaviour across the monitored window.
- The investigation produced a reusable monitoring framework — synthetic monitoring, log correlation and AI-assisted analysis — rather than a one-time troubleshooting effort.
On the outcome claim
We don't claim this class of issue can never occur again. What the monitoring demonstrated is stable, failure-free rendering behaviour throughout the monitored validation period — measured the same way the original problem was found, not just asserted after the fact.
Technologies
Synthetic Monitoring
- Python
- Playwright
- GitHub Actions
Data Pipeline
- PostgreSQL
- Neon PostgreSQL
- SQL
- dbt
Observability
- Grafana
- Loki
- AI-assisted log analysis
GIS Platform
- GeoNode
- GeoServer
- GeoFence
My Role
I led the observability and monitoring side of the investigation end-to-end:
- Monitoring strategy and overall investigation design.
- Synthetic monitoring design and automated implementation.
- Data pipeline design, from raw observations to analytical models.
- PostgreSQL data model for monitoring observations.
- dbt analytical models transforming raw observations into dashboard-ready data.
- Grafana dashboard development and SQL analytics.
- AI-assisted log analysis.
- Correlating monitoring evidence with application and infrastructure logs.
- Technical investigation and diagnosis, working jointly with the GeoServer/GeoFence side of the effort.
Collaboration
This investigation and monitoring solution was developed collaboratively. I worked together with Mushegh Mkrtchyan, GIS Developer at Sivan Design, on the investigation, monitoring implementation and resolution of the rendering issue.
Mushegh contributed to the GeoServer, GeoFence and GIS platform investigation and implementation, while I led the monitoring strategy, synthetic user framework, automation, PostgreSQL and dbt analytics pipeline, Grafana dashboards, analytical modelling and AI-assisted log analysis. The diagnosis and resolution were achieved through close technical collaboration between the two sides of the investigation.