Maps & Geospatial Analysis · 2024
Peak-Hour Fleet Distribution at Special Events: Pride Parade Analysis
Background
Tel Aviv's Pride Parade is the city's largest annual street event, and for a few hours it upends transportation demand downtown. Riders cluster along the route while road closures cut other areas off from e-scooter access. This analysis mapped that mismatch during the parade's peak hour.
Maps — Pride Parade Peak Hour
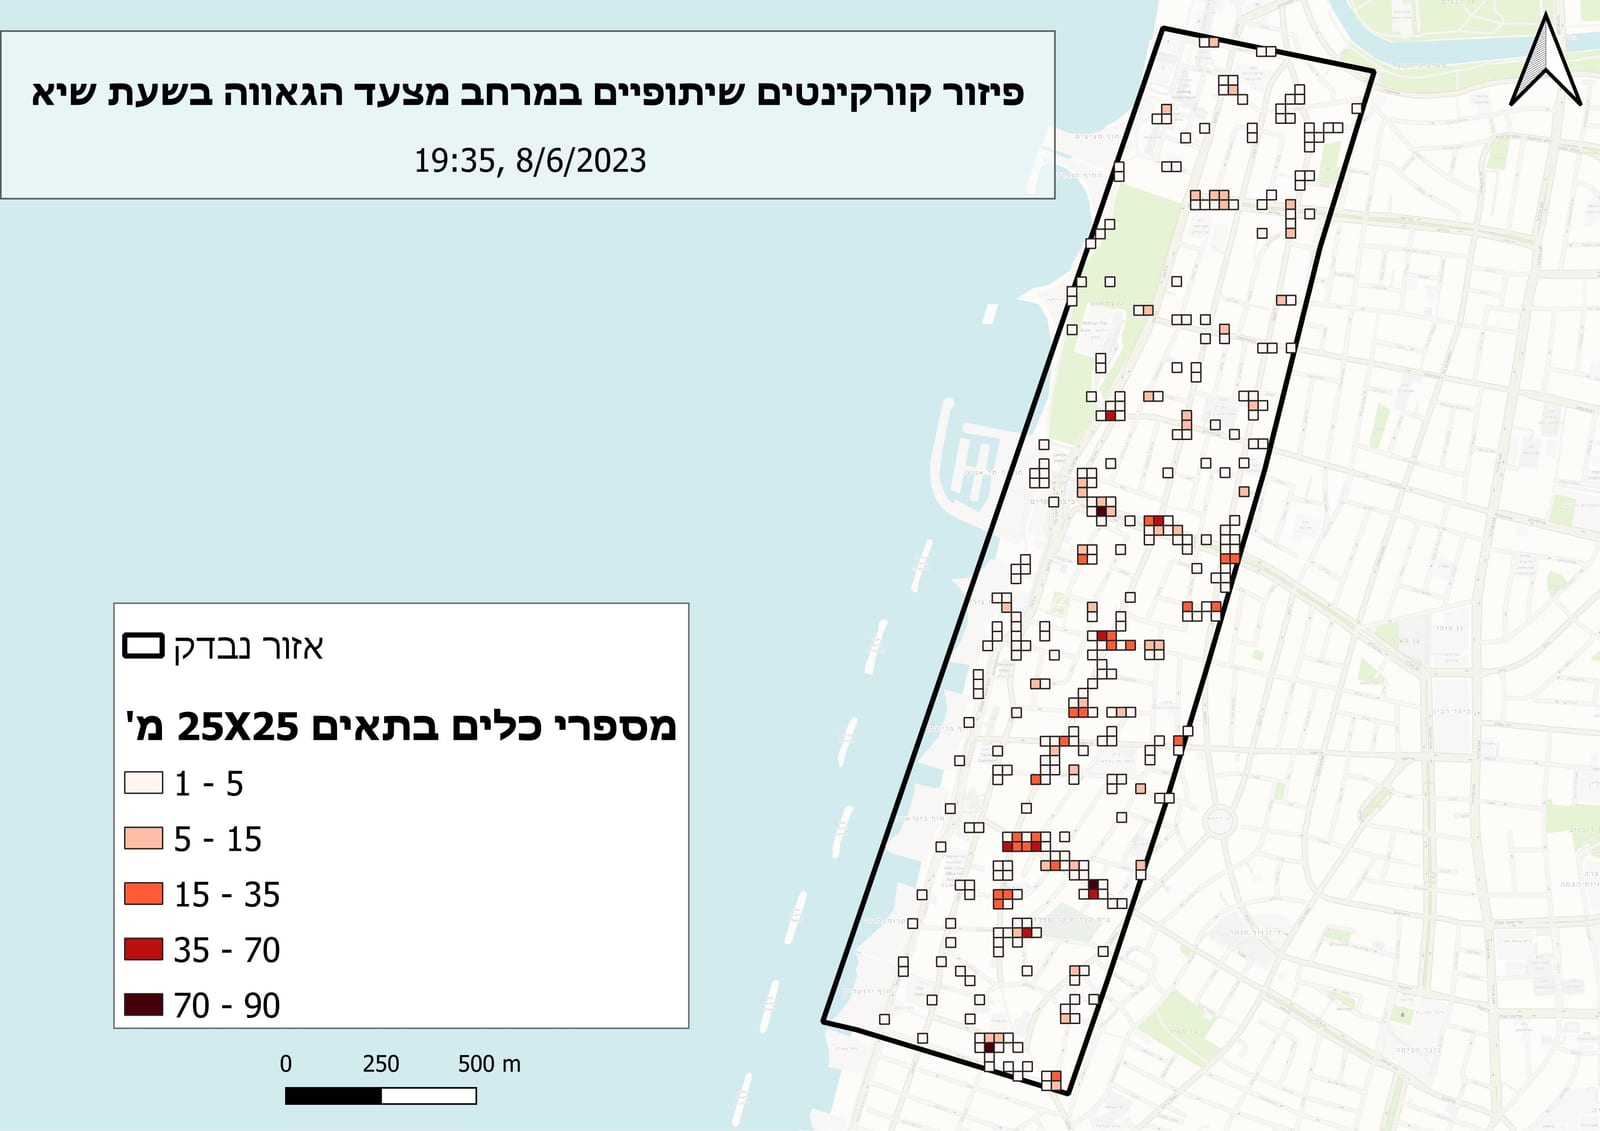
Vehicle fleet distribution at peak hour — Pride Parade 2024.
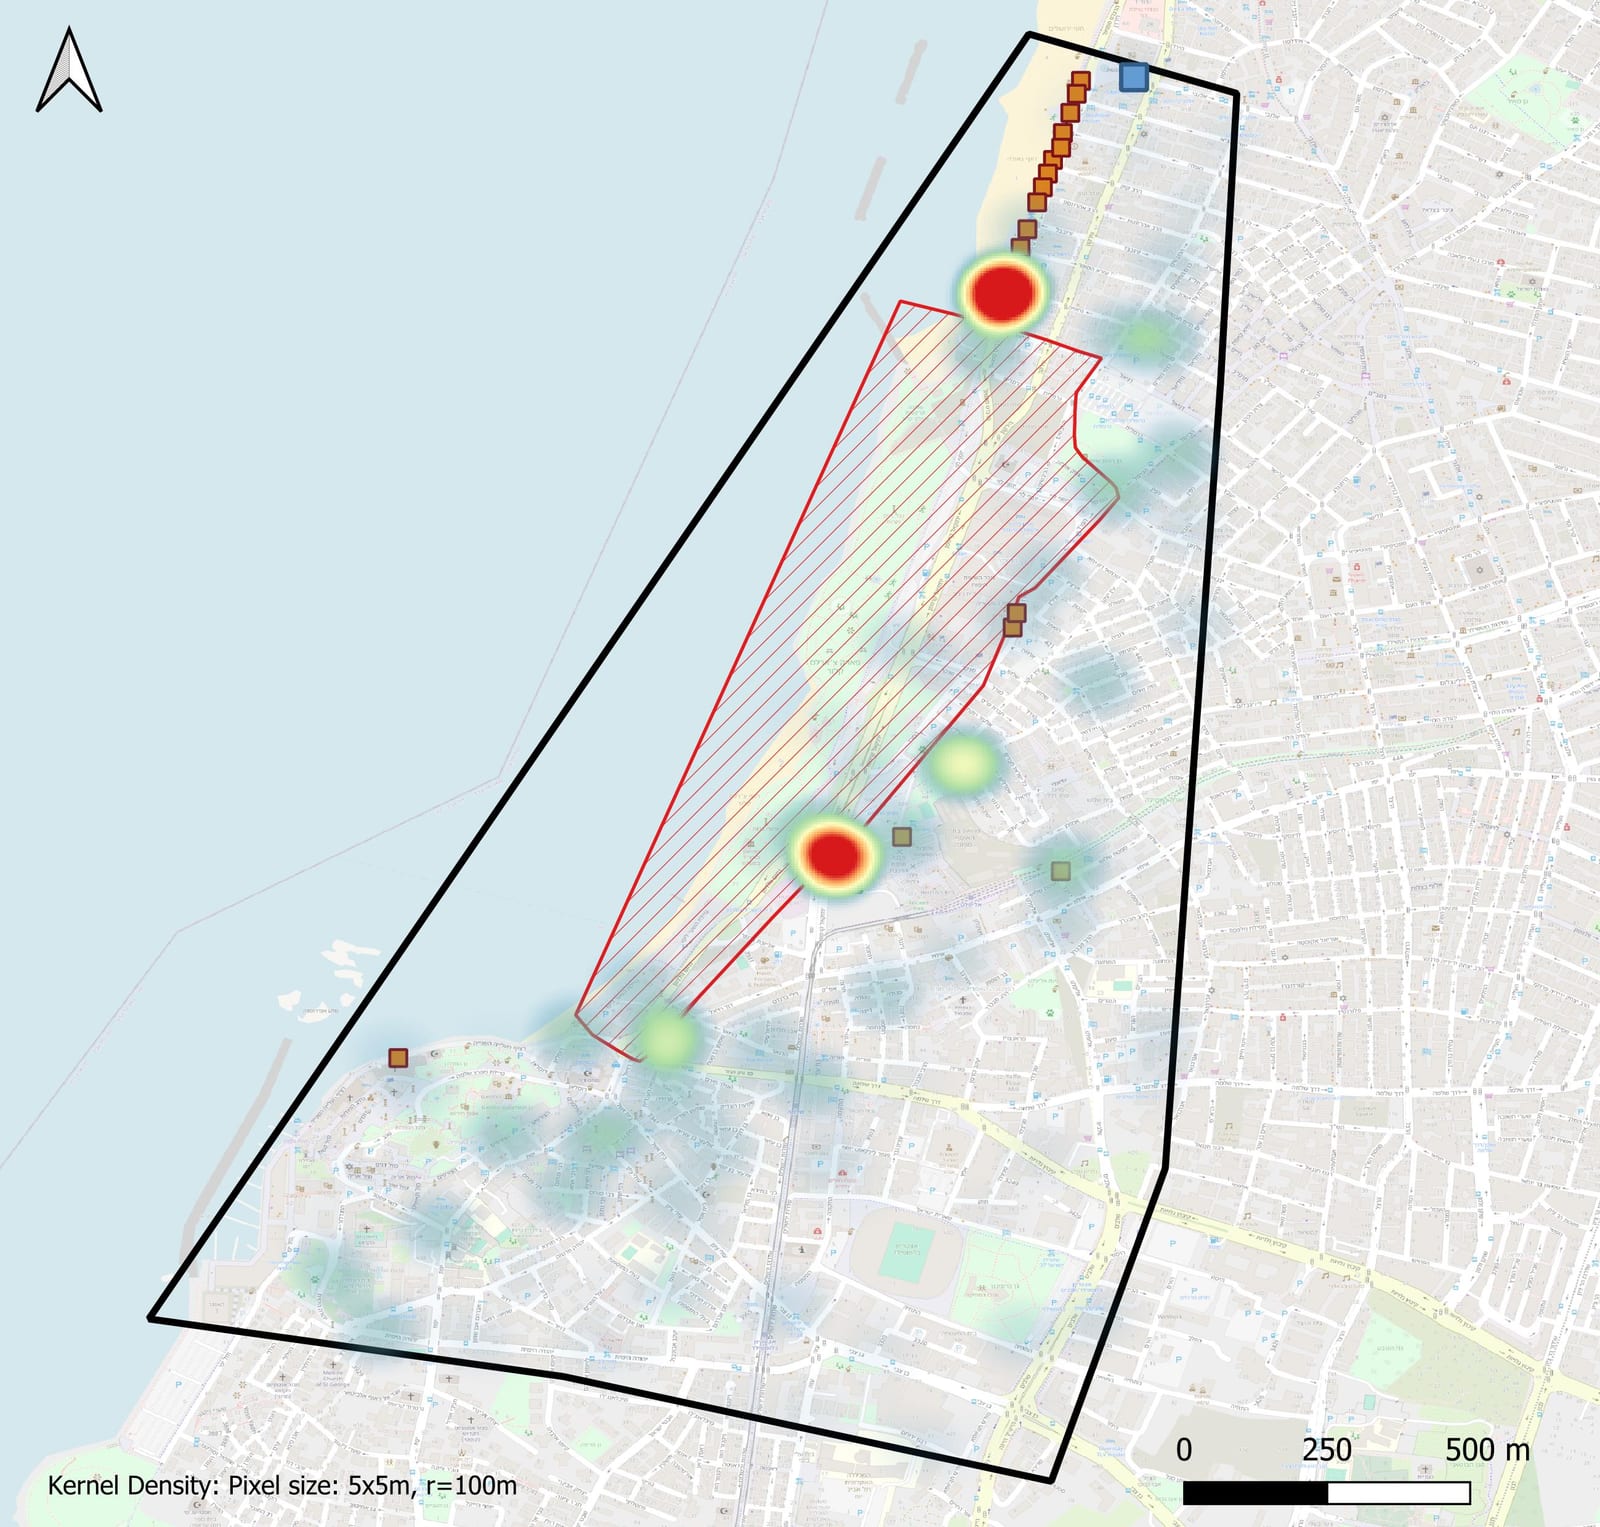
Vehicle density surface during parade peak hour.
Methodology
- Filtered real-time fleet feeds from Populus to the peak-hour window and built point-in-time snapshots with Python and Pandas.
- Joined vehicle locations to a spatial grid and municipal parking-restriction polygons using GeoPandas.
- Generated KDE density surfaces for vehicle supply and trip-origin demand, then visualized both in QGIS at matched scales.
Results
The maps exposed clear gaps between where scooters were parked and where riders needed them — including no-go zones created by parking restrictions with no compensating supply nearby. The findings fed directly into the city's pre-positioning talks with operators ahead of future events.