Maps & Geospatial Analysis · 2024
Bus Service Frequency Changes in Tel Aviv: 2022–2024
Background
How often a bus arrives is one of the clearest measures of transit quality — an 8-minute headway versus a 20-minute one is the difference between a service people rely on and one they plan around. This project tracked how Tel Aviv's bus frequency shifted between 2022 and 2024, and where.
Maps — Year-over-Year Frequency Change
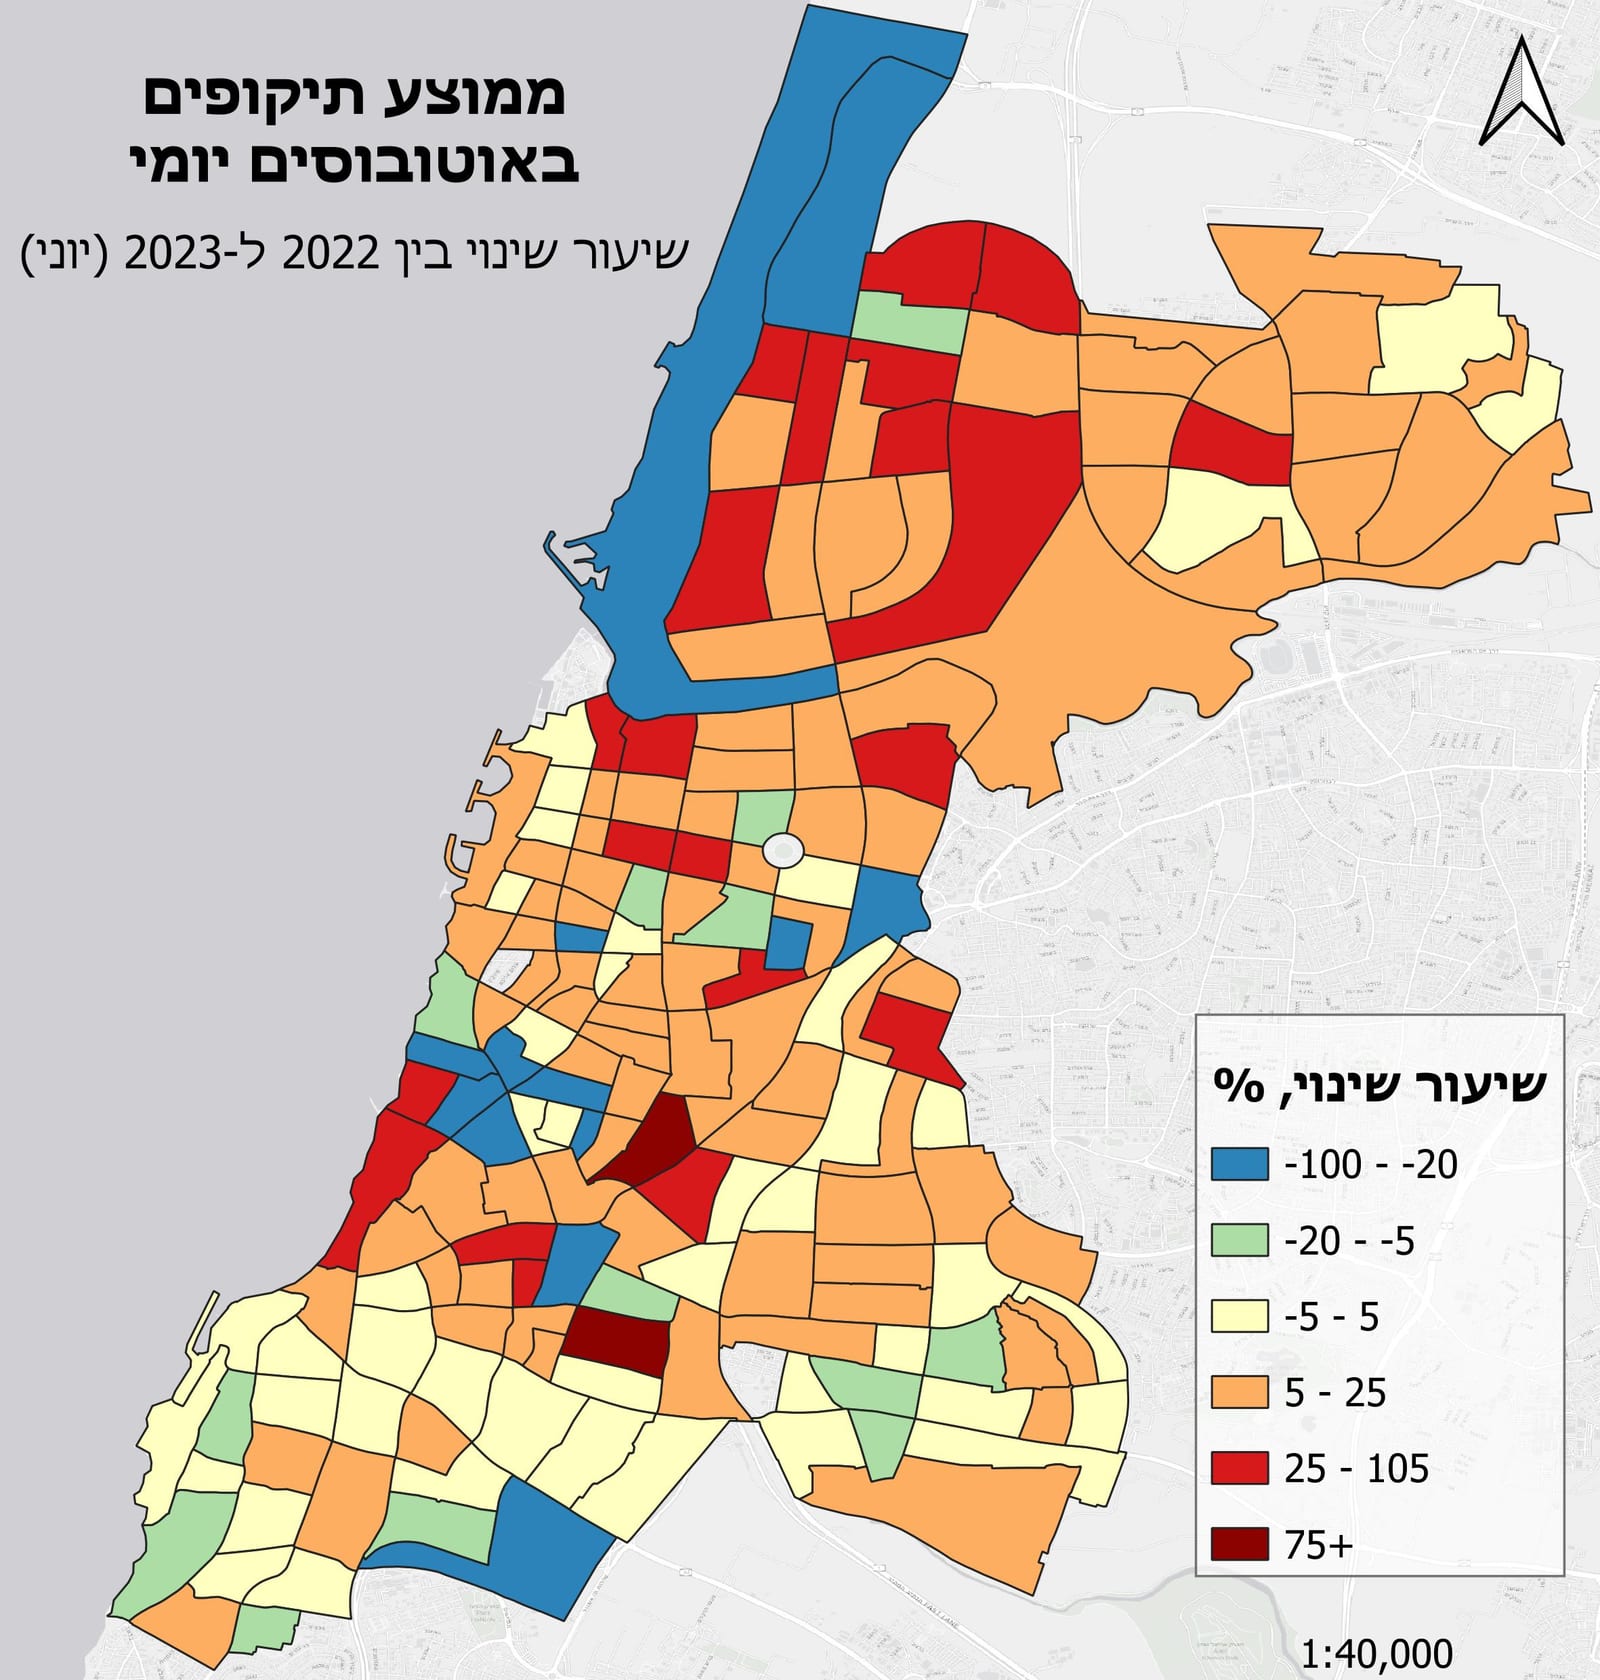
2022 → 2023: Route segments colored by change in service frequency. Green = improved headways; red = reduced frequency.
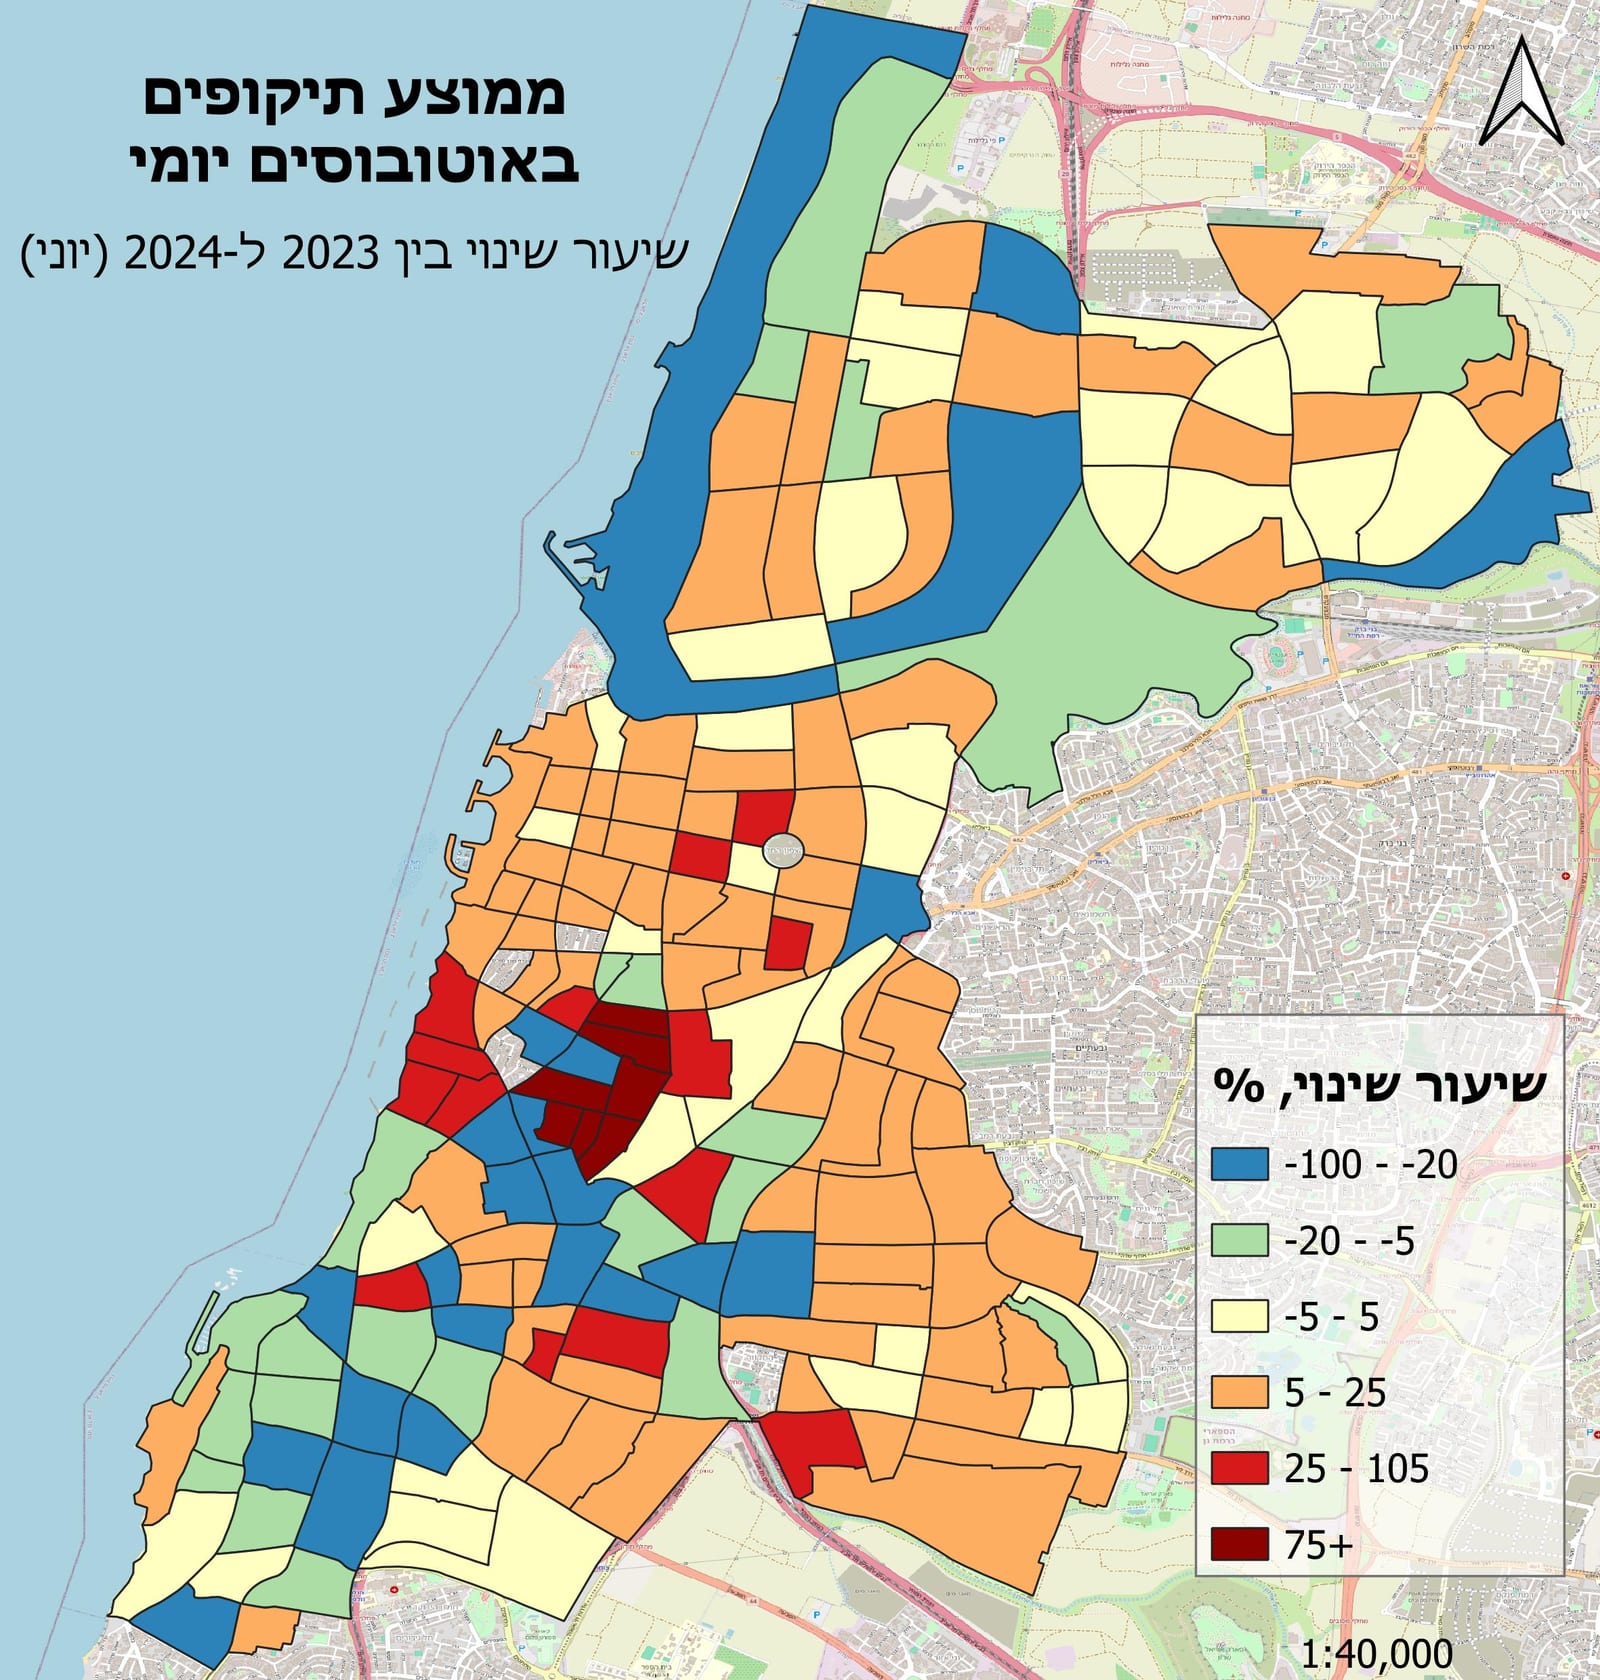
2023 → 2024: Continued restructuring as light rail integration proceeded, with frequency gains on trunk corridors.
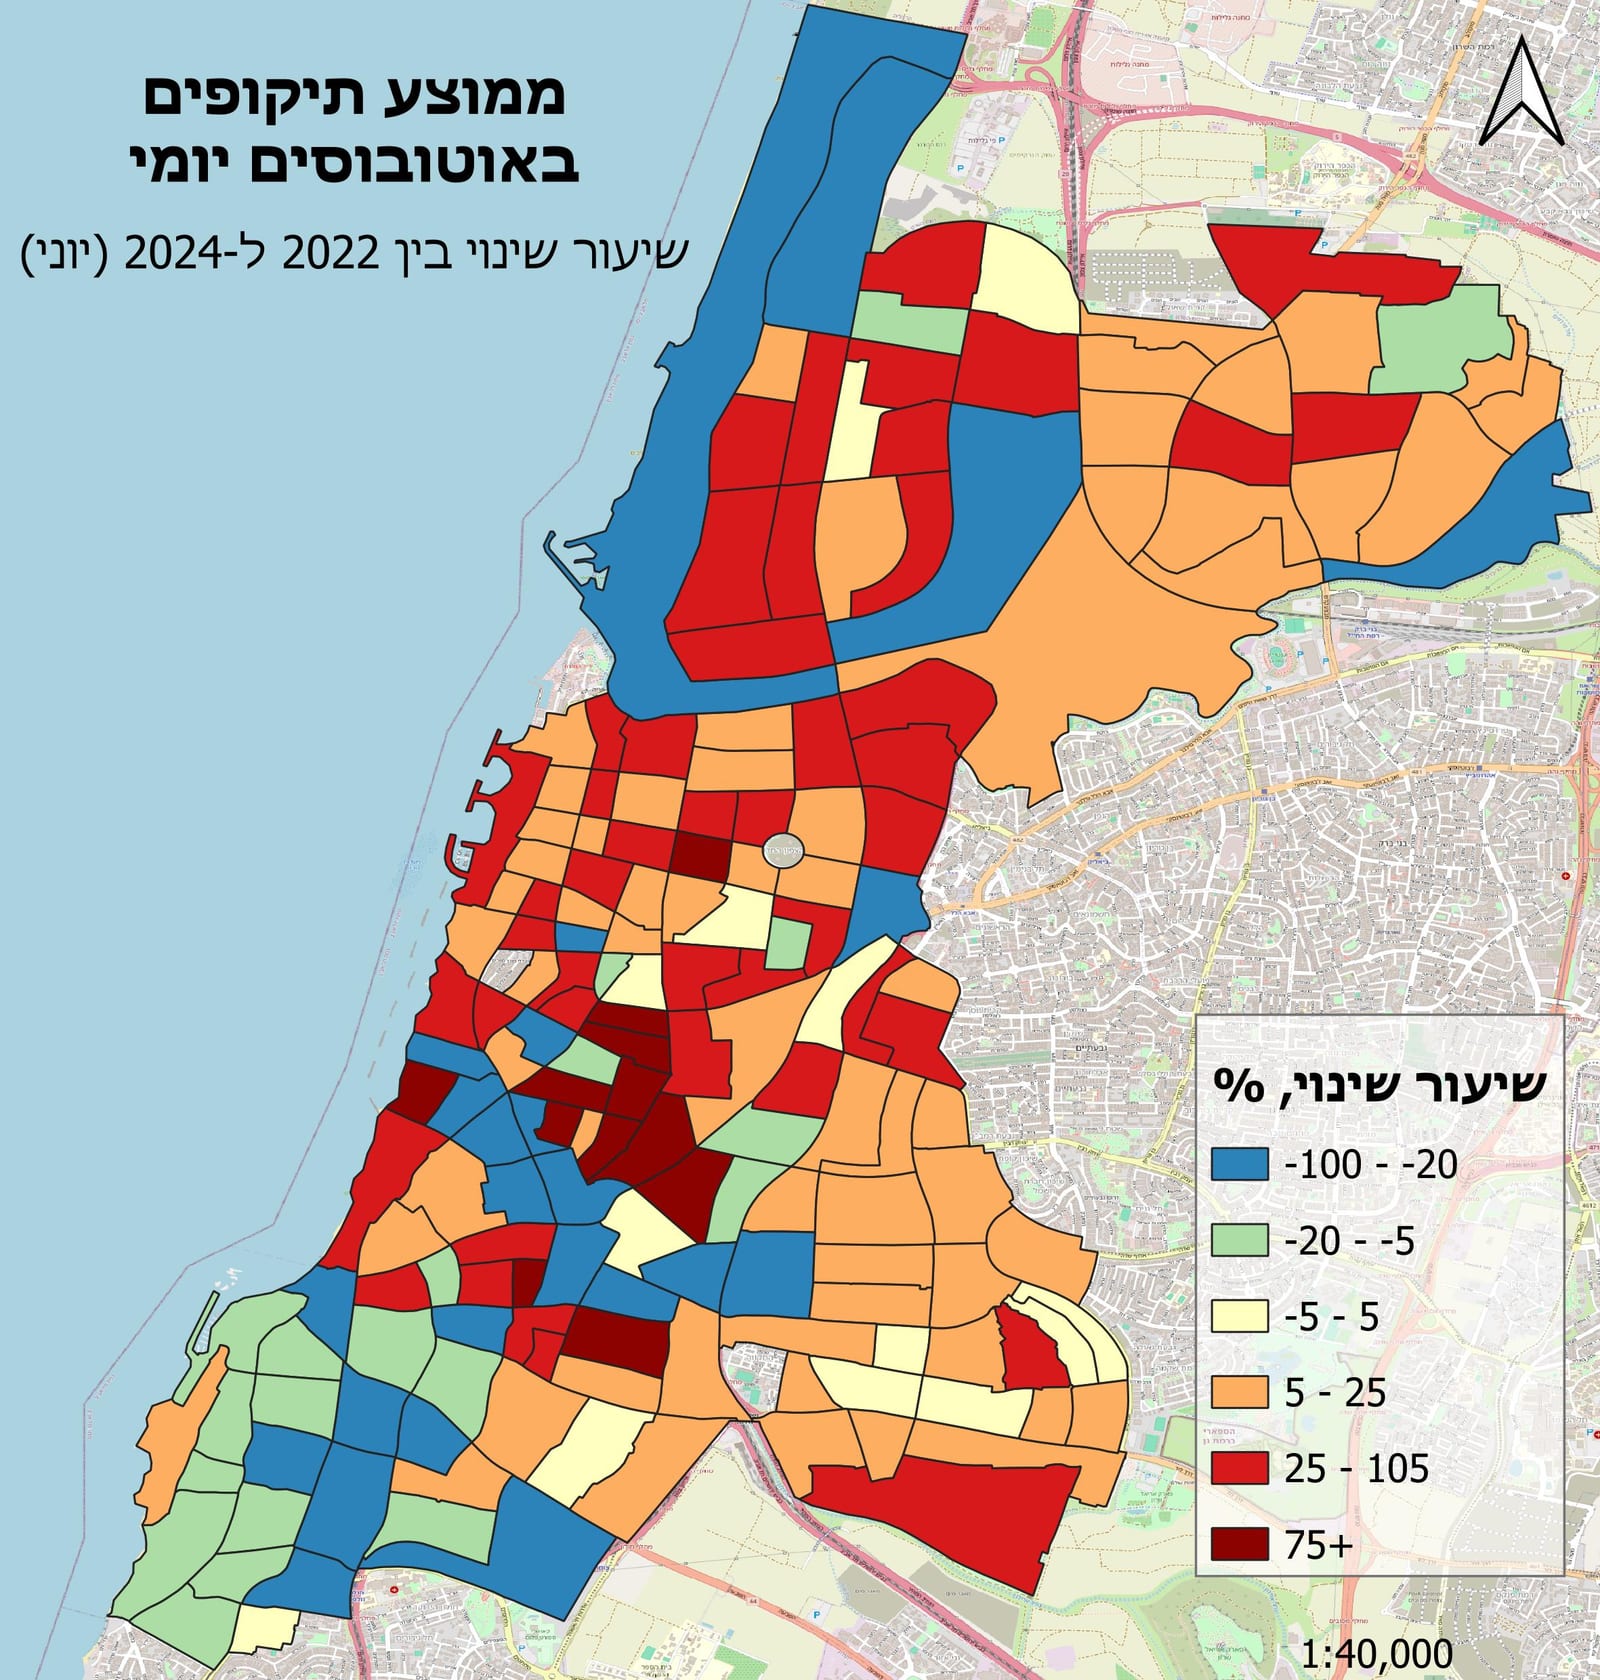
2024 state: Current service frequency baseline across the network.
Methodology
- Processed three years of GTFS feeds in Python to compute average headways by route segment and time period (AM/PM peak, off-peak).
- Matched segments across years by route ID and calculated year-over-year change in headway as the core metric.
- Joined GTFS route geometries to the computed deltas with GeoPandas, then built diverging choropleth maps in QGIS centered on zero change.
Results
The maps surfaced both citywide trends and localized shifts tied to specific restructurings — most notably the new light rail integration, which absorbed bus demand on some corridors while boosting frequency on connecting trunk routes.