Data Science & Analysis · 2025
Israel Train Stations Dashboard
Background
Israel Railways publishes detailed open data on station activity, but digging through it station-by-station takes real effort. This project turns that raw data into an interactive dashboard that lets planners, researchers — or curious commuters — explore departure patterns across the network without writing code.
Screenshots
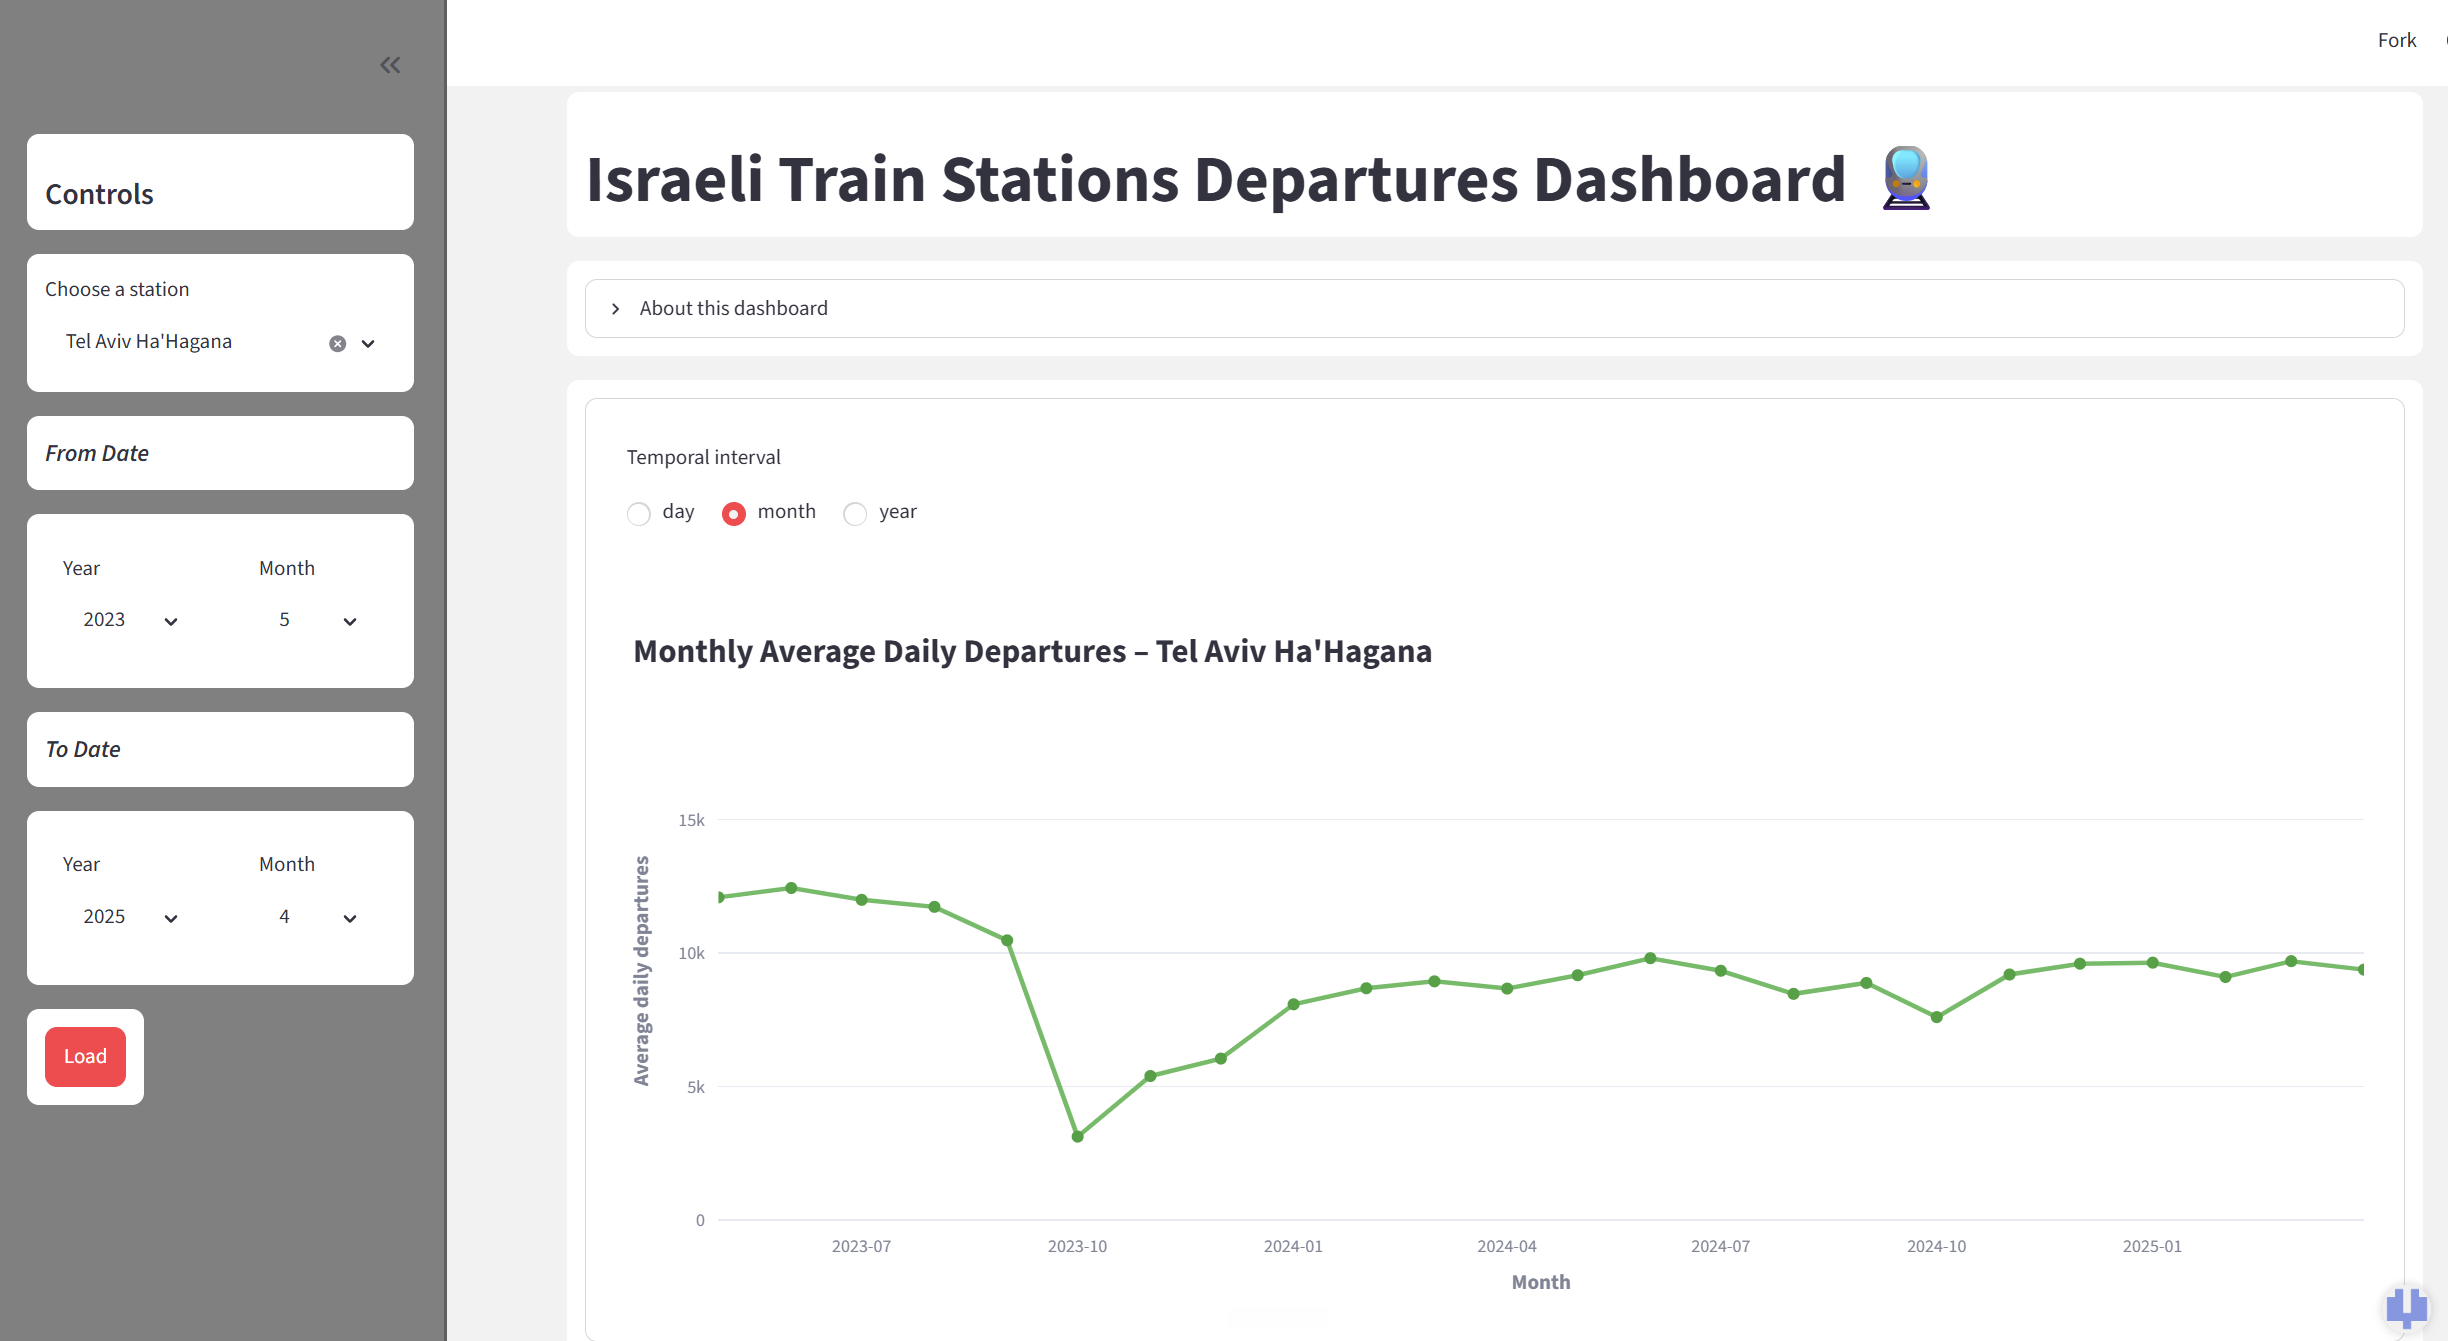
Station explorer view — pick a station and date range to see its average daily departures trend over time.
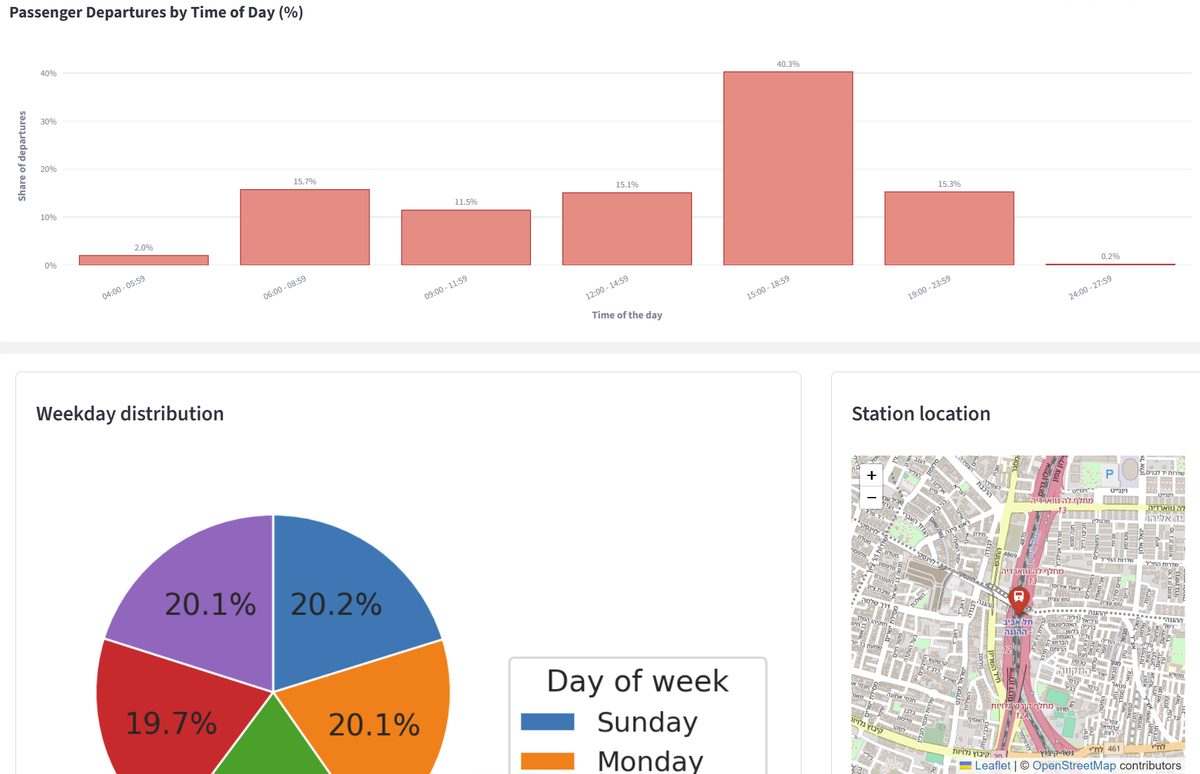
Time-of-day and weekday distributions alongside an embedded map of the selected station's location.
Methodology
- Combined departure-activity data from the Israeli Government Open Data Portal with GTFS station coordinates and 2025 schedules, processed in Pandas.
- Built an interactive Streamlit app for exploring any station's activity at day, month or year resolution, with custom date-range comparisons.
- Implemented working-day logic separating regular service from weekends and Israeli holidays (Jewish calendar), so trends reflect real operating patterns.
- Visualized time-of-day distribution with Plotly charts and an embedded Folium map for geographic context.
Results
The dashboard is live on Streamlit Community Cloud, letting anyone spot peak-hour loads, off-peak gaps and long-term ridership trends across Israel's rail network — no code required.
Try It / Code
The dashboard is deployed live on Streamlit Community Cloud, and the full source is on GitHub.