Data Science & Analysis · 2026
Forecasting E-Scooter Pile-Ups in Tel Aviv-Yafo
Background
Shared dockless e-scooters tend to collect on the same pavements, where they block pedestrians and draw complaints. Cities usually react after a pavement is already blocked. This project asks whether pile-ups can be forecast 1 to 6 hours ahead, on a 100 m grid over Tel Aviv-Yafo, so that rebalancing crews or enforcement can be sent before the pavement fills.
It builds on my MSc thesis and uses a full year (2024) of vehicle-status data. The data was provided by the Tel Aviv-Yafo Municipality, which receives it from the scooter operators.
Methodology
- Streamed 12 monthly archives of MDS Status Changes into vehicle partitions, so a whole year could be processed on a laptop. Joined each vehicle's records into 8.8 M parking events, with every cleaning step counted.
- Built an hourly panel of parked scooters, arrivals, departures and operator drop-offs for 5,149 cells of 100 m, using municipal GIS layers (docking stations, cycling infrastructure) and hourly weather.
- Compared simple baselines with LightGBM (Poisson), a GRU, and spatio-temporal graph neural networks. The best GNN passes messages between touching cells and along a scooter-flow graph learned from consecutive parking events.
- Used a strict, once-only evaluation. Every choice was frozen on a tuning period (Sep–Oct): model variant, seeds, blend weight and flagging cutoffs. A list of 19 test-period events was locked in advance, and only then were Nov–Dec 2024 scored, once.
Results
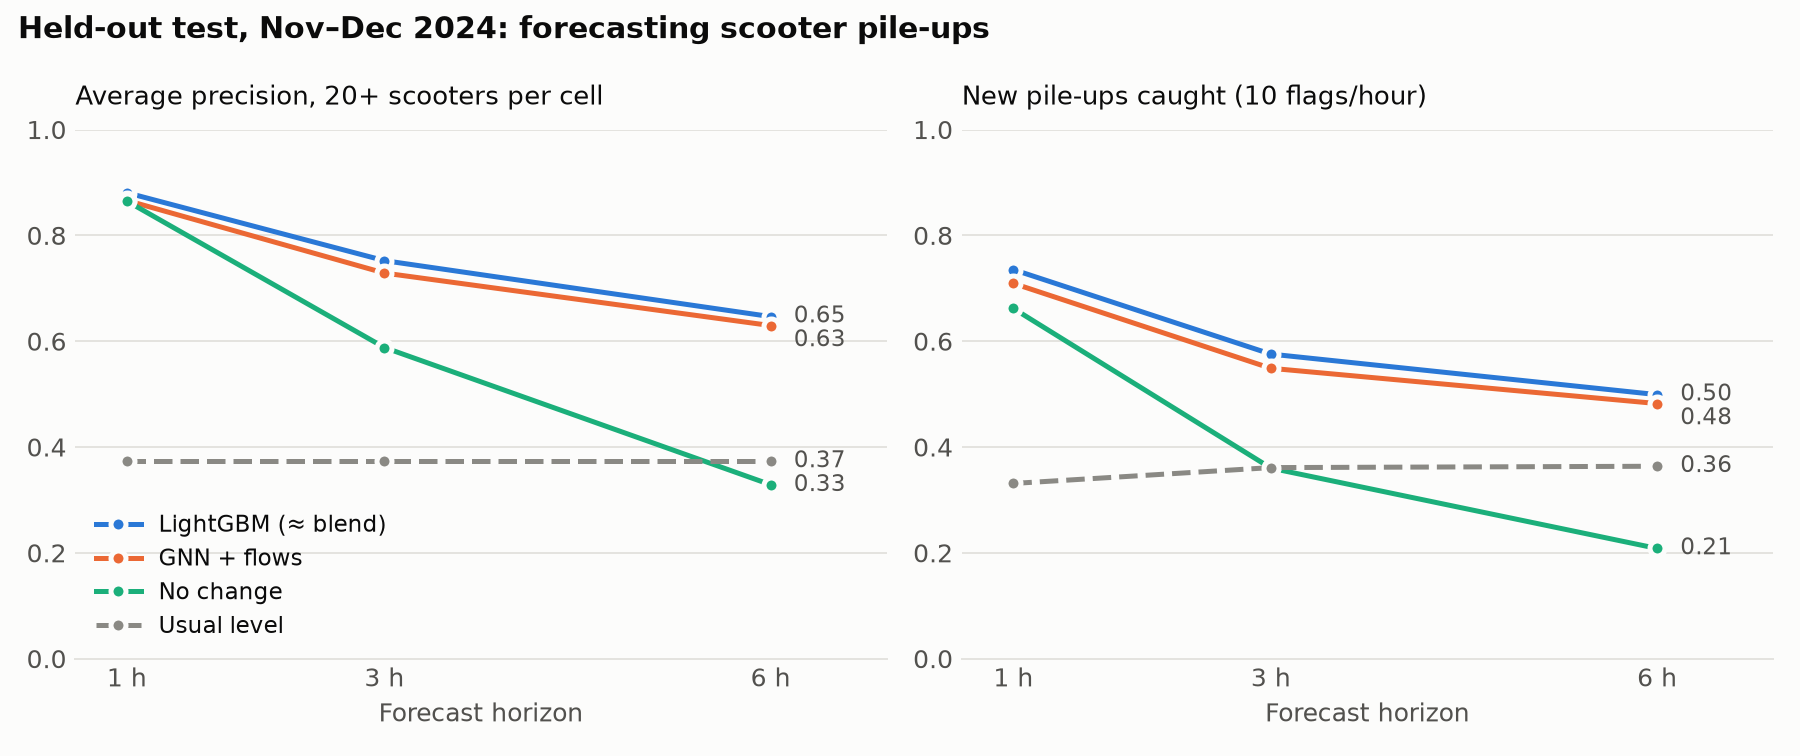
Held-out test, Nov–Dec 2024. LightGBM and the GNN stay well ahead of the baselines at longer horizons. At 6 hours their average precision is about double that of assuming no change.
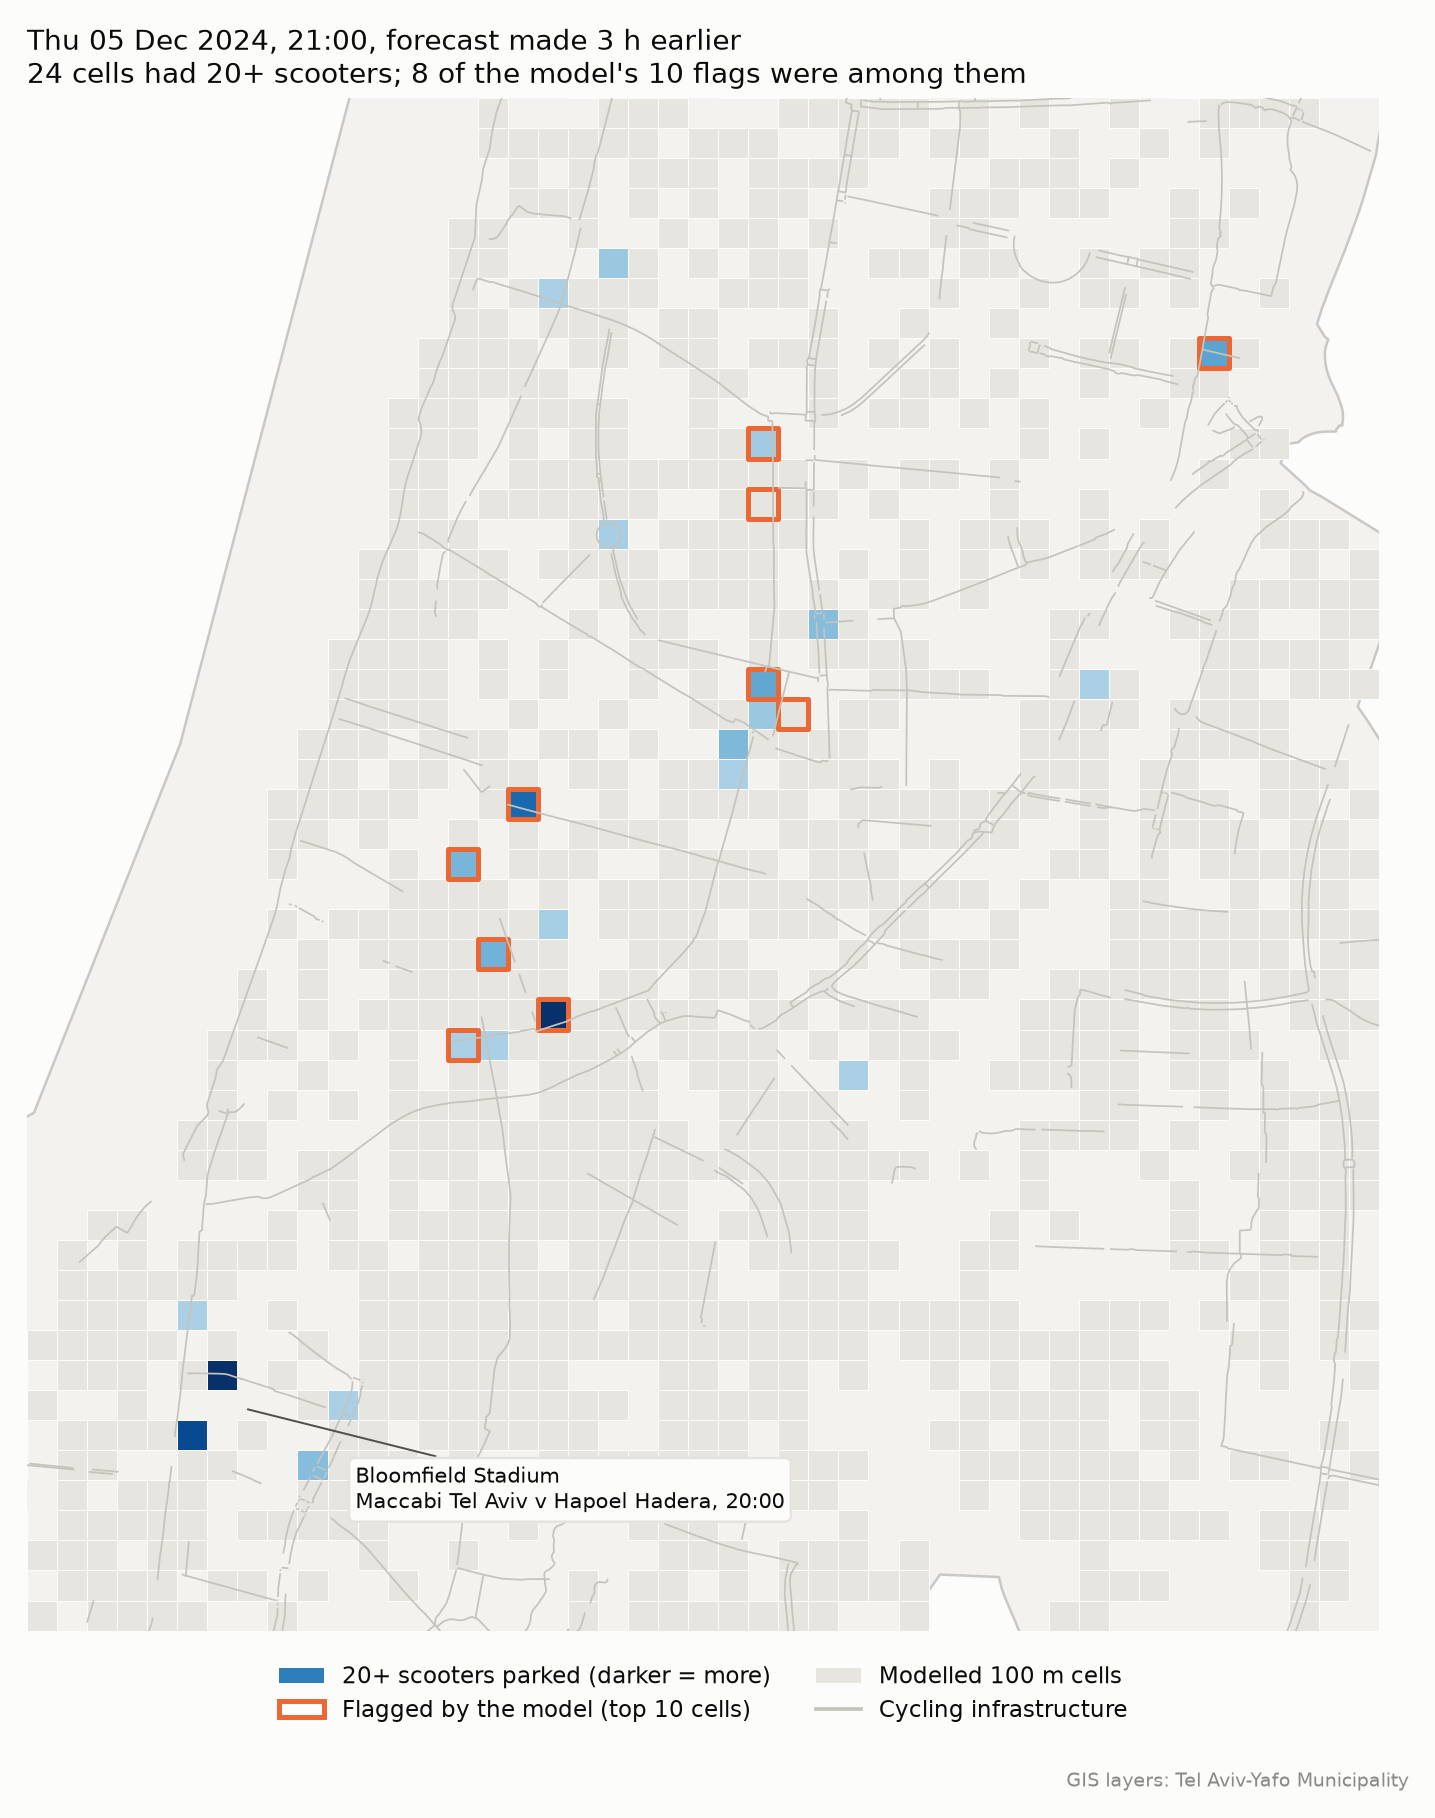
One test hour, with the forecast made 3 hours earlier. Eight of the model's ten flags were real pile-ups. The cells it missed were next to Bloomfield Stadium during a football match.
- At 3 hours ahead, the best model reached AP 0.755 for cells with 20+ scooters, against 0.588 for assuming no change. It caught 58% of new pile-ups with 10 flags per hour, against 36%.
- LightGBM was hard to beat. The flow-graph GNN came within 0.02 AP of it but never passed it, and blending the two added at most 0.004. That is an honest negative result for the more complex model.
- Event crowds are the blind spot. Around football matches the models caught few pile-ups, which points to event calendars as the next feature to add. Missile-alert days, by contrast, did not reduce accuracy.
Code
The full pipeline, tests, result tables and write-up are on GitHub. The operator data itself is not published.
View repository on GitHub →